Data Processing
Since its inception, CDIP has been committed to using a fully-automated, realtime processing system for all of the data the program collects. This emphasis allows us to provide the most up-to-date and relevant coastal data to a wide range of users, from surfers and boaters to the National Weather Service. But the data are not only timely; the processing system includes a range of rigorous quality control tests, ensuring that CDIP data are highly accurate and reliable as well.
System Organization
Every 30 minutes of every day, each buoy and shore station contacts the virtual computer located within Amazon’s cloud. The acquisition software compiles that data into files which are lightly processed and forwarded to CDIP’s central computing facility at SIO. Those files are then passed through CDIP’s automated processing and distribution system. This system performs a wide range of analyses and data transformations, producing everything from error reports and diagnostic e-mail to condensed paramters and web tables.
When the data first arrive in the Lab, they are ‘raw’ data files, that is they are data directly as read from the sensors in the field, without any significant modification or editing. The data in these files have not been decoded or calibrated; they are effectively a byte-by-byte record of a sensor’s output. There are many different types of raw data files depending on the sensor and method of data acquisition.
Turning this raw data into to all of the valuable products and information that are found on the CDIP website is basically a two-step process. First, after verifying the source and timing of the file, it is either decoded, or in the case of non-buoy data (pressure sensor, anemometer, etc.), calibrated and used to produce a calibrated version of the original file, called a ‘df’ - diskfarm - file.
The next step of the processing addresses the question: how well is the sensor measuring what it’s supposed to? A range of quality control checks are performed on the data, to check if they are suitable for further processing. If so, a variety of calculations and transformations are performed on the data, and finally the results are distributed to all the appropriate products. (For a more detailed version of the image below, please see the processing flowchart.)

Software
At the heart of CDIP’s processing system is a FORTRAN program called meta_proc. This program processes hundreds of data files a day, supplying thousands of users with the information they need. Meta_proc relies on two important archives of information to know exactly how to process each file originating from a specific sensor at a specific station: the sensor archive and the processing archive.
The sensor archive
The sensor archive is a database that holds complete descriptions of all the sensors that have been deployed in the field to collect data for CDIP. Serial numbers, deployment and recovery dates, water depths: they are all detailed in the sensor archive.
Sample information from the sensor archive 
The processing archive
Like the sensor archive, the processing archive is a database containing a number of time frames for each station. These time frames give complete processing instructions for a station at any point in its history. For example, for an array of pressure sensors, the processing archive will state which of the sensors should undergo “Gauge comparisons”, a rigorous set of quality control checks designed to confirm that the data from closely-associated pressure sensors is in agreement. The processing archive will also state which sensors should be used for directional processing. For a station like Harvest Platform (063), with eight pressure sensors in close proximity, the sensors used for directional processing may vary considerably over the life of the station.
Sample information from the processing archive 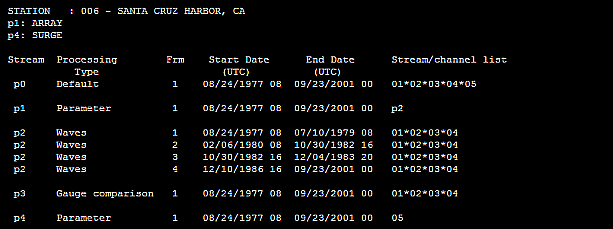
The processing archive also spells out which sensors should be used to produce all of the plots, tables, and other products that are generated from the diskfarm and made accessible on the web. By setting up a number of “parameter streams” in the processing archive, different products can be generated for a single station and presented to web users as separate data sets.
Sensor and processing archive descriptions
META_PROC: Getting data to our users
Once meta_proc has consulted the processing archive and assembled all the instructions for handling a station’s data, it proceeds through three main stages of processing. First comes quality control and editing. The data are subjected to a range of tests - checks for extreme values, spikes, abnormal distributions, etc. (For a more detailed description of the tests used, please see the following section, on quality control.) When problems are found in the data, the values may be edited - perhaps removing a spike from a time series - or they may be rejected as unfit for further processing.
If the data pass the QC tests, processing continues to the next stage: decoding and transformation. This is where FORTRAN’s number-crunching facilities are used to great advantage, as the bulk of the calculations occur at this point. In wave analysis, for instance, the time series from pressure sensors undergo spectral and directional analyses, and a range of algorithms transform the data into spectral coefficients, condensed parameters (Hs, Tp, etc.), and the like.
At this stage of the processing - as at most others - Datawell directional buoys are treated somewhat differently than other sensors. Datawell buoys perrform spectral and directional analyses internally, and the buoys output this spectral data along with the buoy’s displacement time series. For this reason, CDIP does not actually do any number-crunching for the Datawell buoys. Instead, meta_proc simply decodes the spectral information produced by the buoy itself.
Once all of the calculations have been completed, further QC is performed: are the results reasonable? If so, there is one remaining stage to the processing: distributing the results to all of the relevant products. Since a single station’s sensors may be used to generate a number of different data sets at any point in time, meta_proc carefully follows the processing archive’s instructions to ensure that its results are added to all of the appropriate files and databases. Once this last stage is complete, all of CDIP’s standard products are easily accessible to web users, the National Weather Service, and a number of research insitutions.
More: |
Quality Control
CDIP needs to provide its users with data which are not only timely, but accurate as well; this is a responsibility that is taken very seriously. Rigorous quality controls are implemented at several stages in the processing, and catch the vast majority of problematic files.
As described above, the first quality control checks ensure that each data file is properly attributed, with its full provenance - both time and place - accounted for. Then, as the data are processed by meta_proc, CDIP’s full suite of QC algorithms and analyses is deployed. For time series data, a wide range of analyses are used, with different tests applied to different data types. For water column and vertical displacement time series - i.e. wave measurements - the checks include: extreme values test, spike test, mean shift test, flat episodes test, mean crossing test, equal peaks test, acceleration test, and period distribution test. Some of the tests edit the time series, cleaning up the data where possible; others simply flag it bad. Where multiple sensors are deployed in close proximity, the above tests are followed by a battery of comparison tests, to ensure that the sensors are in agreement. For a full description of the tests used and the data types to which they are applied, please refer to our QC documentation.
|
Time series from a buoy with a bad hippy (heave-pitch-yaw) sensor |
Once the time series have been processed, the resulting values - condensed parameters and spectral information - also undergo QC checks. For Datawell buoys these checks are quite extensive, since the buoys perform their own time-series handling and spectral processing internally. For example, the time series above shows a problem - spikes in a large, long-period waveform - that CDIP’s time series tests could easily identify. But since this data is from a Datawell buoy, the time series was processed internally, so no CDIP editing was applied.
Nonetheless, CDIP’s post-processing checks correctly identify the problem with this file, since the resulting spectral distribution and parameter values (in this case Tp) are skewed. Here the long-period spikes result in a spectral shift to lower frequencies, and in an unnaturally high Tp value (approximately 28 seconds).
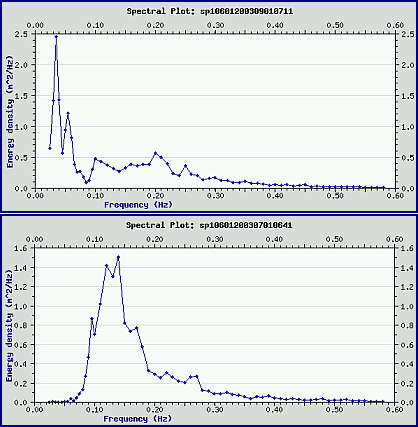
Two spectral plots. The upper plot shows the shifted distribution of the time series data above; the lower plot shows a more typical spectral distribution.
In addition to the checks outlined above, there is one more full stage of automated QC applied to CDIP data. While all the previous analyses are applied to a single file’s data, the final QC tests address a station’s data over longer time periods, dozens of files. Once per day, all of a station’s recently acquired condensed parameters are compiled and compared. Once again, a range of tests check for spikes, unusual values, and the like, notifying CDIP staff via e-mail if anything seems amiss. (Please read our post-processing documentation for more details.) All of these automated measures, combined with periodic visual inspections, are very effective in preventing the distribution of erroneous data.
More: |
Buoy Check Factors
Datawell directional buoys return ‘check factors’ for each frequency band in the spectra they calculate. The ratio of horizontal displacements to vertical displacements, these check factors are an important tool in performing QC on the buoy data.
In general, the mid-frequency and high-frequency check factor values should be very close to one. (The low-frequency bands often have very low energy levels, so their check factor values are more variable.) When the mid- or high-frequency check factors deviate significantly from one, it indicates that there is likely an issue with buoy. Below are some examples of these issues as highlighted by the check factor values.
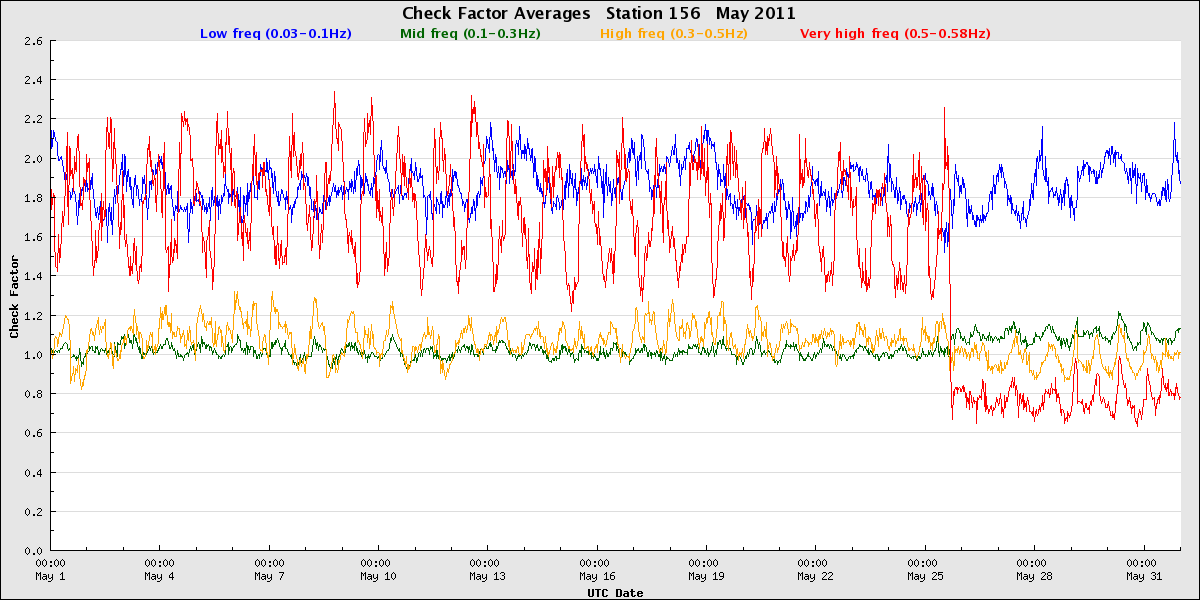
Monterey Canyon - fouling and cleaning (May 25, 2011)
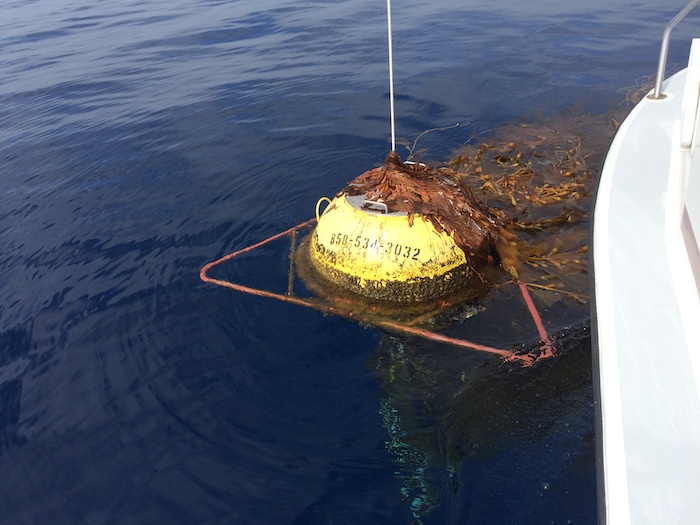
Although anti-fouling coatings are used on the buoys, they sometimes accumulate considerable marine growth. When the buoy and mooring are covered with barnacles and other organisms, the high-frequency response can suffer. These changes are reflected in the check factors.
Fouled Monterey Canyon Buoy.
Monterey Canyon check factor values when heavily fouled and after cleaning the hull.
Oceanside Offshore - transient fouling
The buoys may also be exposed to transient sources of bio-fouling, such as when they are surrounded by kelp. For instance, in October 2014 the Oceanside Offshore buoy was entangled in kelp for more than three days, with the check factors indicating that motion was significantly restricted. After that the waters cleared around the buoy and the check factor values returned to normal. There was, however, some kelp left atop the buoy, as shown in the picture. This kelp covered the GPS antenna on the tophat and prevented GPS updates until the buoy was serviced.
Oceanside Offshore kelp entaglement.
Check factors averages showing restricted motion.
San Francisco Bar - tides and currents
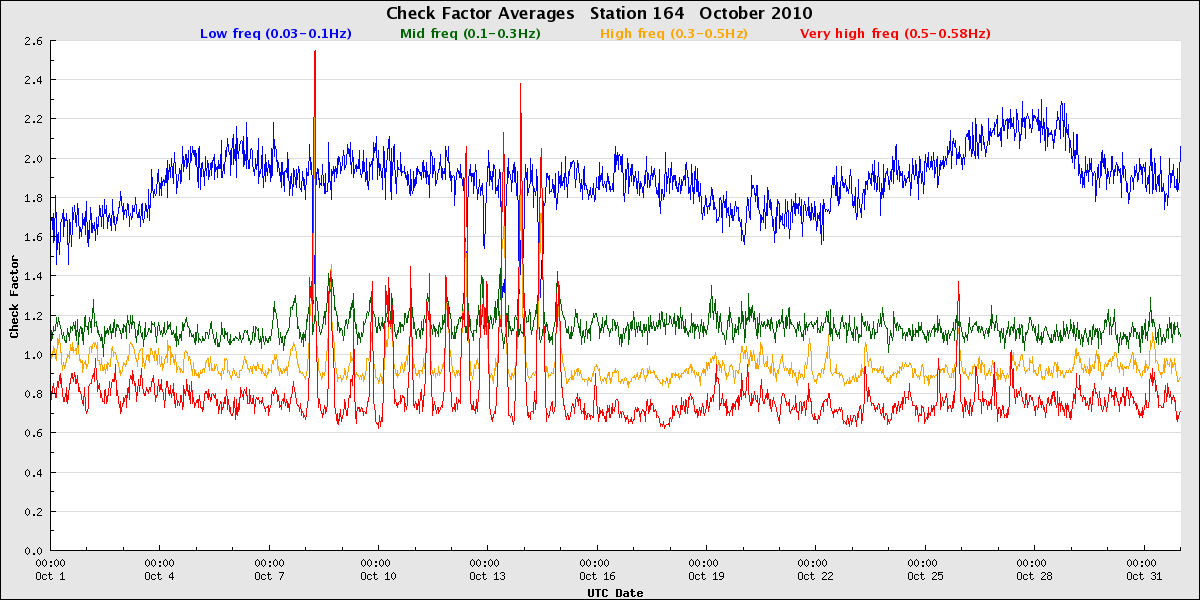
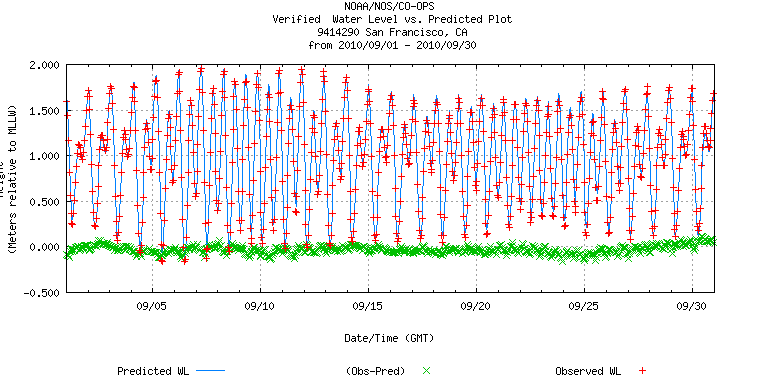
Buoys deployed in areas with strong currents often have check factor values that track along with changes in the currents; the force of the current can reduce buoy response. The San Francisco Bar buoy experiences strong tidal-driven currents, and the variablility in its check factor values can be largely accounted for by the changing tidal cycles.
Cook Inlet - tides and currents
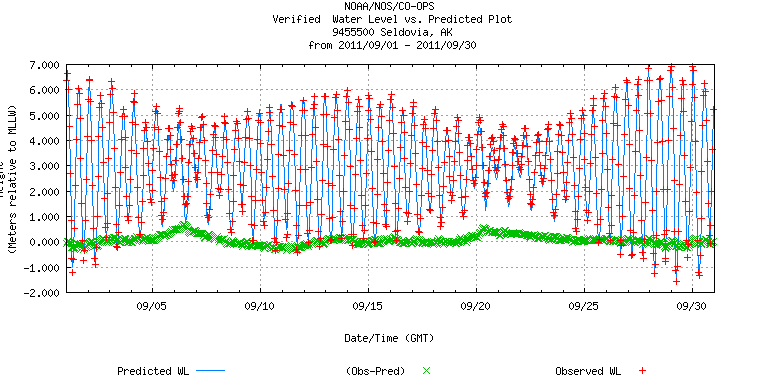
Cook Inlet also experiences strong tidal shifts and currents, and the check factors reflect this. Its check factors, however, are far more variable than at SF Bar. Since the inlet is quite sheltered, it seems that the currents have a far greater impact on buoy motion than they do in locations which are more exposed to wave energy.
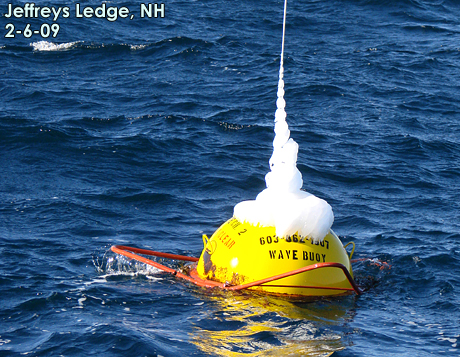
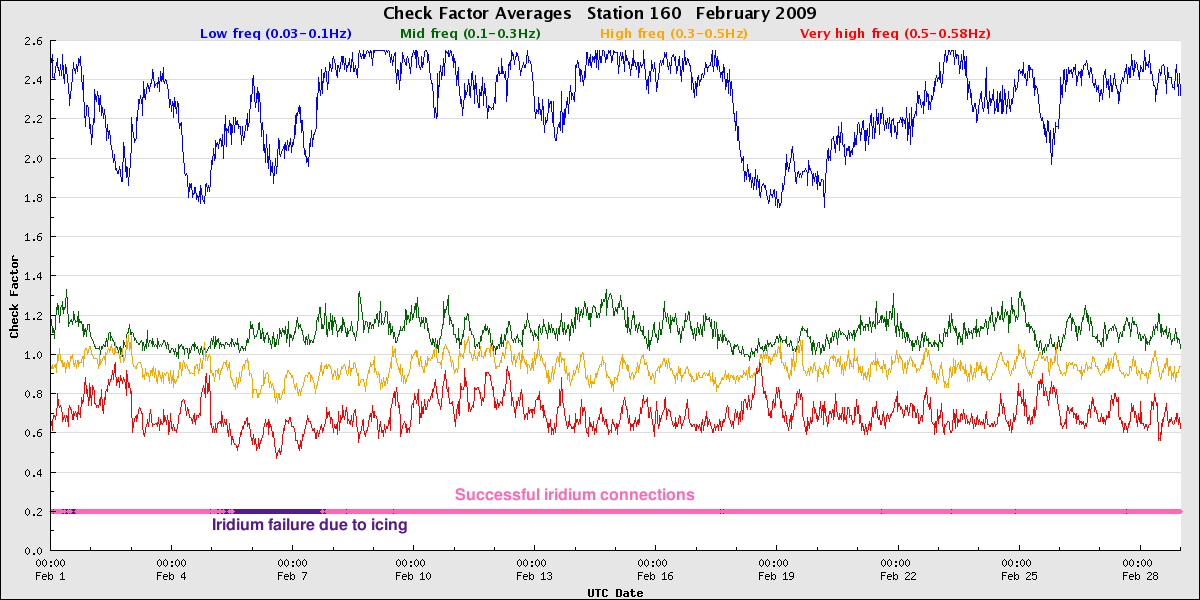
Jeffreys Ledge - icing
In very cold climates like in New Hampshire, the buoys can ice up in the wintertime. When this happens, the buoy’s satellite communications often fail. Data from the buoys internal loggers, however, show normal check factor values, indicating that the icing doesn’t significantly impact buoy motion.
Barbers Point - fishing
When small craft tie up to a buoy’s mooring, the check factors can show changes in the buoy’s response. In Hawaii, fish-aggregating devices or FADs are used and look very similar to CDIP’s buoys. Below the check factors for Barbers Point show intermittent problems with high-frequency response, likely caused by small fishing craft.
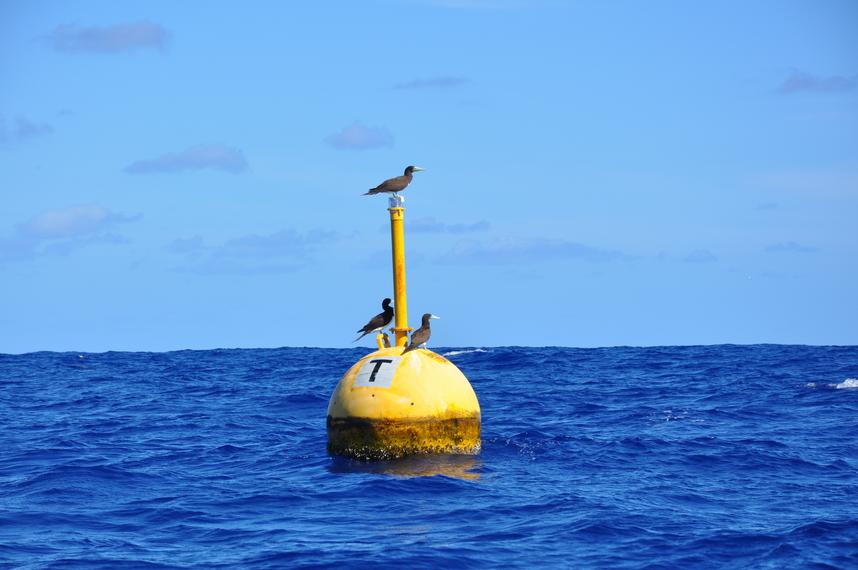
Fish-aggregating device (FAD)
Check factor plot showing likely tie ups from small fishing craft.
Majuro - fishing?
In the Marshall Islands, the check factors sometime look similar to those from Barbers Point. These times of poor buoy response are often times when the buoy’s Iridium satellite transmissions also drop out.
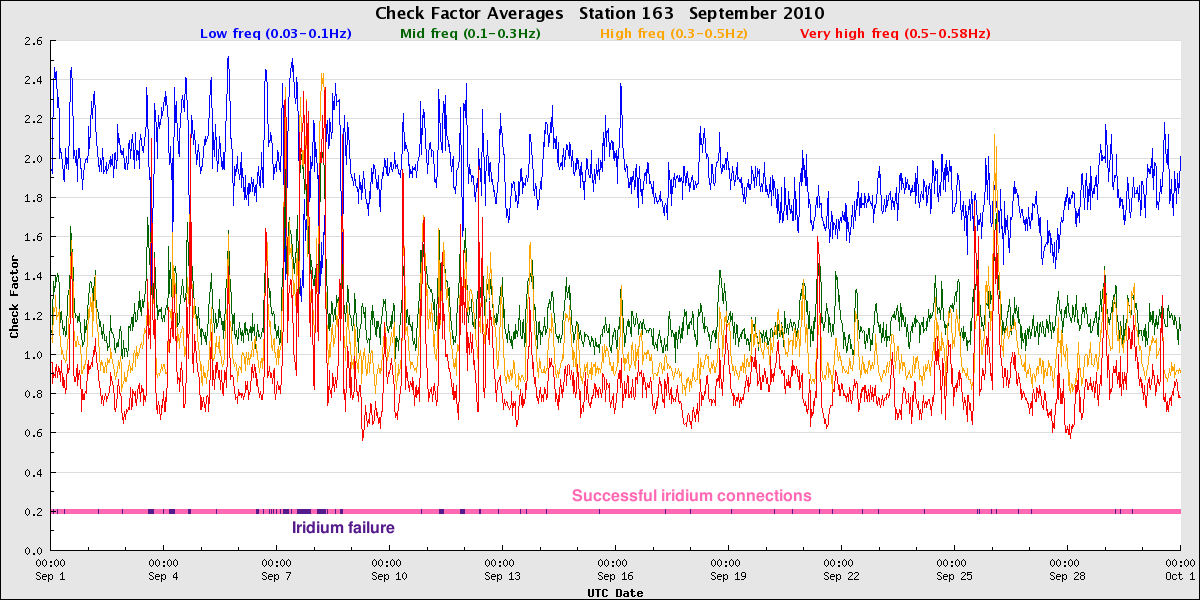
Point Loma South, buoy failure
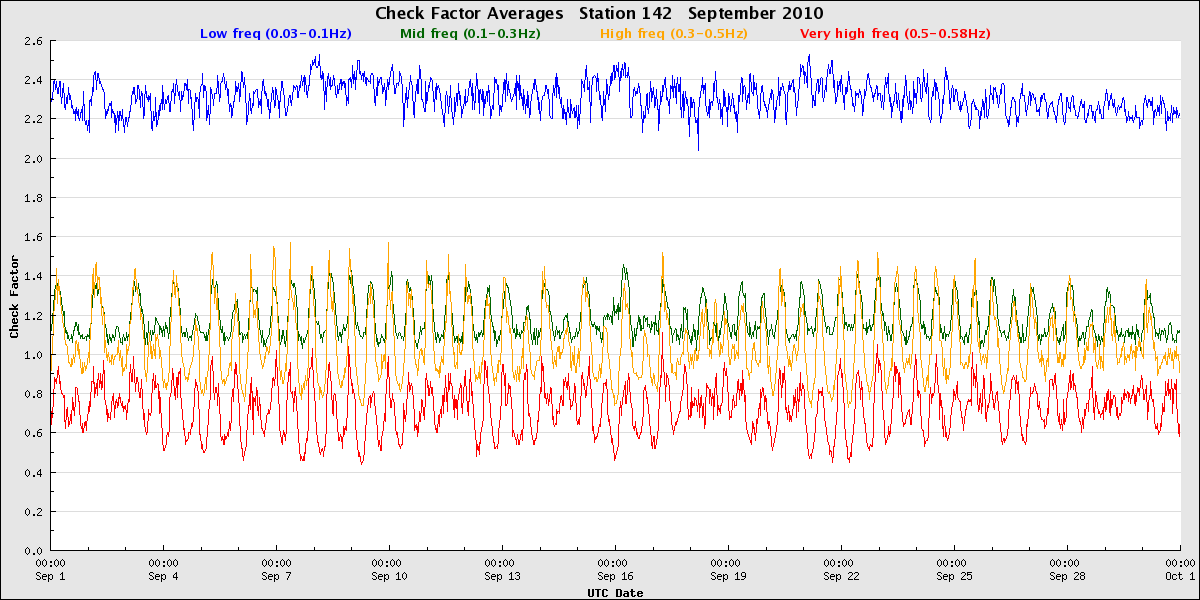
In September 2010, a rather heavily-fouled buoy at Point Loma South was replaced. The check factors of the replacement buoy, however, also looked off, with mid-frequency check factor values lower than the higher frequency values. This was in fact a buoy that had just experienced a sensor failure, perhaps when in transit to the site. The pre- and post-deployment calibration checks help highlight such issues.


